|
 |
|
KonSi
Malmquist Index
SoftWare
T H E O R Y
&
A P P L I C A T I O N S |
Convenient program for your reseaches of dynamic efficiency by using Malmquist Index method
|
 Malmquist Index Software Malmquist Index Software
Examples of program reports on Malmquist Index analysis
Screenshots of Malmquist Index Software
Malmquist Index Bibliography
Download Malmquist Index Software with User's Guide
Malmquist Index Software: Buy Now
KonSi
Malmquist Index SoftWare
This program is tool for your researches of dynamic of efficiency by using Malmquist Index. Malmquist Index and its components are calculated for many periods. You may get reports with calculated values of Malmquist Index for researched objects.
You may read User's guide to study of capacities of Malmquist Index Software. You download User's Giude with software.
This program calculates values of Malmquist Index and its components by using following formulas:
This program is created on the base of following Malmquist Index methods which you find in these papers:
You may study process of Malmquist Index calculation step-by-step using screenshots of program. You must execute following steps:
- prepare your data for each unit and each period as excel table;
- import your data to Malmquist Index Software;
- define type of Malmquist Index ( input-or-output oriented Malmquist Index );
- select Malmquist Index Method;
- create reports with calculated values of Malmquist Index, its components and CRS-VRS efficiencies for each time period.
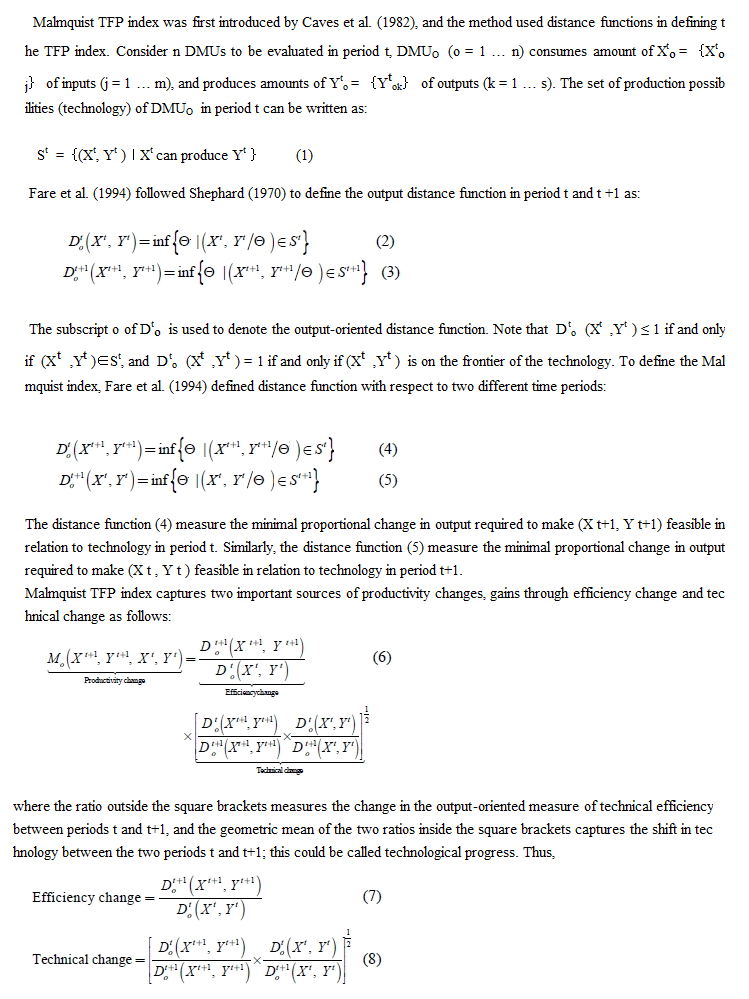
YOUR INPUT DATA FOR MALMQUIST INDEX SOFTWARE
Source Data Requirements
The source data for analysis in KonSi - Malmquist Index Software v. 2.1 should meet the following requirements:
- The first row (parameter names row) should contain names of parameters describing researched object system;
- The first column (the DMU names column) should contain names of researched objects;
- The rest table cells should contain non-zero numerical data about parameter values of researched objects. The data should correspond to the objects enumeration order in the DMU names column and parameters enumeration order in the parameter names row;
- Each table row should store data about one object in one time moment. The pair “time moment name and object name” is defined as a data item. This pair should be unique;
- For each object, data should be provided for all considered time periods. The time period is determined by two moments as time interval. The first time moment is called “a base moment” ( the starting point of time interval ). The second time moment is called “analyzed moment” ( the end point of time interval);
- Name of each data item should contain the name of the time moment ( the starting point OR the end point) to which the object data are related. The time moment name should stand before the object name and be separated from it with a special symbol (underscore symbol (‘_’) by default). An example of a proper data item name is “sep2013_DMU1” where sep2013 is time moment name and DMU1 is analyzed object name.
- To avoid errors connected to bad recognition of time moment names or object names, neither time moment names nor object names should contain the underscore symbol (‘_’); Attention! This example “sep_2013_DMU1” is error because the term “sep_2013” contains symbol (‘_’). Proper example is “sep2013_DMU1”.
- The data should be sorted according to the following rules:
- Data about the first object in all time moments should come first in source data table. After the first object, the data about the second object should be provided in a similar way etc.
- The names of time moments should be enumerated according to their lexicographical order in terms of their names semantics (i.e. January before February, Monday before Tuesday etc.). The time moment names order should be correctly specified at least for the first object being researched.
If your source data do not meet these requirements, this may lead to errors while importing data using Importer or conducting their analysis using KonSi - Malmquist Index Software.
The following illustration shows the data set meeting all requirements specified in this section.
Figure 1. Example of source data meeting all requirements
In the example shown on Figure 1, the data have been provided for 4 objects (Dmu1, Dmu2, Dmu3, Dmu4) which change their parameters within 6 time moments (Jan12, Feb12, Mar12, Jan13, Feb13 and Mar13). Parameter values specified for object Dmu1 related to time period Jan12 are provided in the table row corresponding to the data item “Jan12_Dmu1”.
Source Data Preparation for KonSi - Adjacent & Fixed-base Malmquist Index Software
The KonSi - Malmquist Index Software program requires that the source data are prepared as an .xml file generated in the Importer utility.
To prepare your data for analysis in KonSi - Malmquist Index Software, execute the following steps:
- Make sure that your source data meet all requirements. For source data requirements, see Source Data Requirements section or Figure 1.
- Save the data as a .csv file. On Figure 2, you can see how to properly save your data in this format using Microsoft Excel.
- Import the saved data file to .xml format using the Importer utility. To launch the Importer utility, click Start, click All Programs, click KonSi – Malmquist Index Software and then click 1_Import Source Data from CSV to XML file.

Figure 3 Launching Importer utility from the Start menu
Processing source data using KonSi – Malmquist Index Software
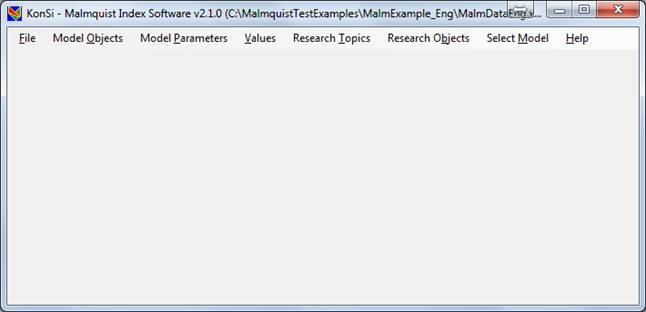
Figure 11 Main window of KonSi – Malmquist Index Software when the source data file is opened
PROGRAM REALIZES MAIN MALMQUIST INDEX METHODS
Figure 12 Malmquist Index Calculation window
REPORTS CREATED MALMQUIST INDEX SOFTWARE
Reports generated by KonSi - Malmquist Index Software
KonSi - Malmquist Index Software generates five reports. The program saves them as .csv files. The reports are named in the following way:
- Specific report name which identifies the contents of the generated report. Names given by KonSi - Adjacent & Fixed-base Malmquist Index Software to the generated reports are as follows:
- Rpt1_MalmReportsDescription – a report explaining terms or names used in other generated reports;
- Rpt2_MI – a report containing Malmquist index and its components computed for your dataset;
- Rpt3_MalmEff - a report containing DEA efficiencies computed during Malmquist index calculation;
- Rpt4_DataForRegression – a report containing data about Malmquist index, its components, DEA efficiencies computed during Malmquist index calculation and parameters of researched objects. This report may be used for regression analysis. You may use Malmquist index values as dependent variable and other data as independent variables.
- Rpt5_DataForPivotTable – a report containing data about Malmquist index, its components, DEA efficiencies and object parameters. In this report, time periods information is displayed in columns separate from object names column so that this report can be used for creating a pivot table using Microsoft Excel for your research paper.
Names of report files containing information about Malmquist index components (Rpt2_MI) and efficiencies computed during Malmquist index calculation (Rpt3_MalmEff) contain the following additional information:
- Method used for Malmquist index calculation, which was selected in the Malmquist Index Calculation window. This element may have one of the following values:
- “FixedBase” which means that the Malmquist index and its components are computed using fixed-base method, i.e. one time moment is selected as a base time and the calculation is performed relative to that particular base time moment;
- “Seasonal” which means that the Malmquist index and its components were computed using adjacent-base method, i.e. each of the periods is used as a base time moment and a analyzed time moment is shifted to a given number of time moments relative to the base time moment.
- Strategy-specific options which are as follows:
- “BaseTime_Name” (for “FixedBase” method) – an option indicating name of the time moment selected as a fixed base for computing Malmquist index
- “SeasonLength_Value” (for “Seasonal” method) – an option indicating the number of time moments to which analyzed time are shifted relative to base moments when “Seasonal” method is selected.
|